Build a React Excel-like Grid with SmartClient

Most React projects use a third-party component when they require a responsive and dynamic data grid. Sadly, most third-party libraries can’t quite offer the extensive feature set that enterprise applications need to manage millions of rows of data.
If this is your situation, the SmartClient React component is your best choice. SmartClient provides a comprehensive suite of UI components for building React grids, especially for enterprise businesses.
SmartClient grids are more than just a set of rows and columns; they offer customizable Excel-like grids with many components and features, including data management, advanced caching, and data reuse across components. You can also access functionalities like editable cells, inline filters, sorting, pivot tables, advanced filtering, saved search, mass editing, and more.
In this blog post, you will find out about the SmartClient React library and its Excel-like features for building enterprise data grid UIs.
React Excel-like grid features in SmartClient
The truth: SmartClient has an incredibly comprehensive React UI library with easily customizable grid layouts and components. You can easily manage, sort, filter, edit, or paginate large datasets, without stress.
You don’t have to start writing everything from scratch – all the Excel-like features you need are already built into the SmartClient library.
For instance, to create a grid in React using SmartClient, simply import the ListGrid component from the SmartClient’s React library. Bind it to a DataSource and include it in your component’s render method or JSX return statement to display the grid. That’s it!
import React from 'react';
import { ListGrid, LGField } from 'smartclient-enterprise/react';

const ReifyApp = () => {

    return (
        <div>
                <ListGrid
                    ID="myGrid"
                    dataSource="DataSource" // Bind DataSource here
                    autoFetchData="true"
                    width="1000"
                    height="300"
                >
                    <fields>
                        // OPTIONAL: visible grid fields
                        <LGField name="Name" title="Name" />
                        <LGField name="Job" title="Title" />
                        // ...
                    </fields>
                </ListGrid>
        </div>
    );
};

export default ReifyApp;
Just like that, SmartClient automatically renders a grid in your React application.
Your DataSource can be in various formats: XML, JSON, CSV, etc. That’s all you actually need to produce fully functional data grids or forms for your app.
So, let’s check out some of the fascinating Excel-like grid features in SmartClient.
Inline and advanced filtering
Like Excel spreadsheets, there’s always a need to filter and analyze large datasets, either through the inline filter or some advanced filter options. SmartClient’s built-in features make filtering a satisfying experience, with inline and advanced filtering options for even more complex scenarios or diverse data.
To implement inline filtering in a SmartClient grid within React, just set the showFilterEditor property of the ListGrid component to true. This adds a filter editor row at the top of each column.
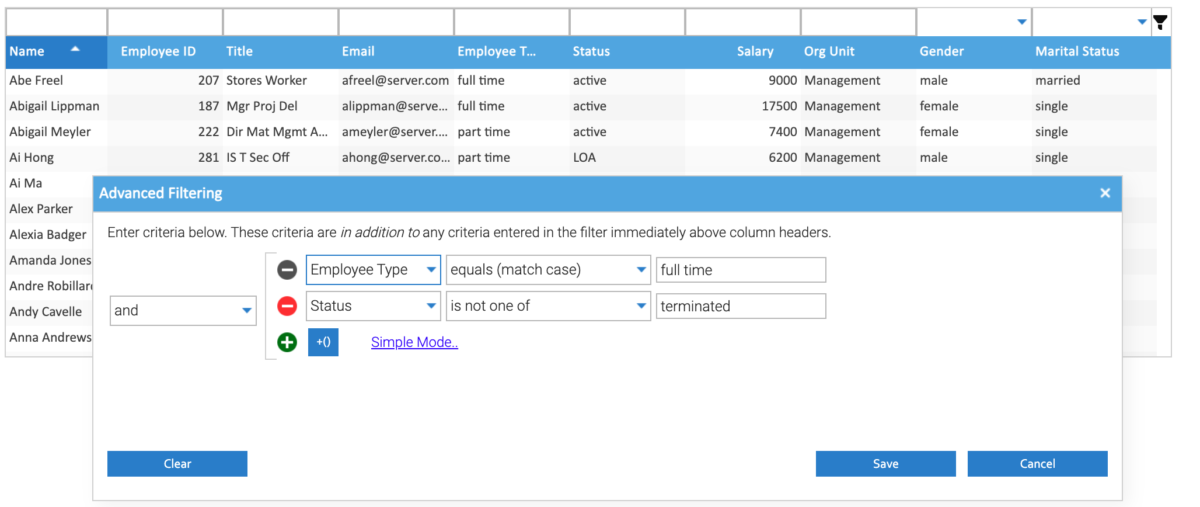
For advanced filtering options, simply right-click on the React grid column, and navigate to “Advanced filtering”. This will open a FilterBuilder window where you can enter complex filter criteria, including AND/OR operations.
Editable cells
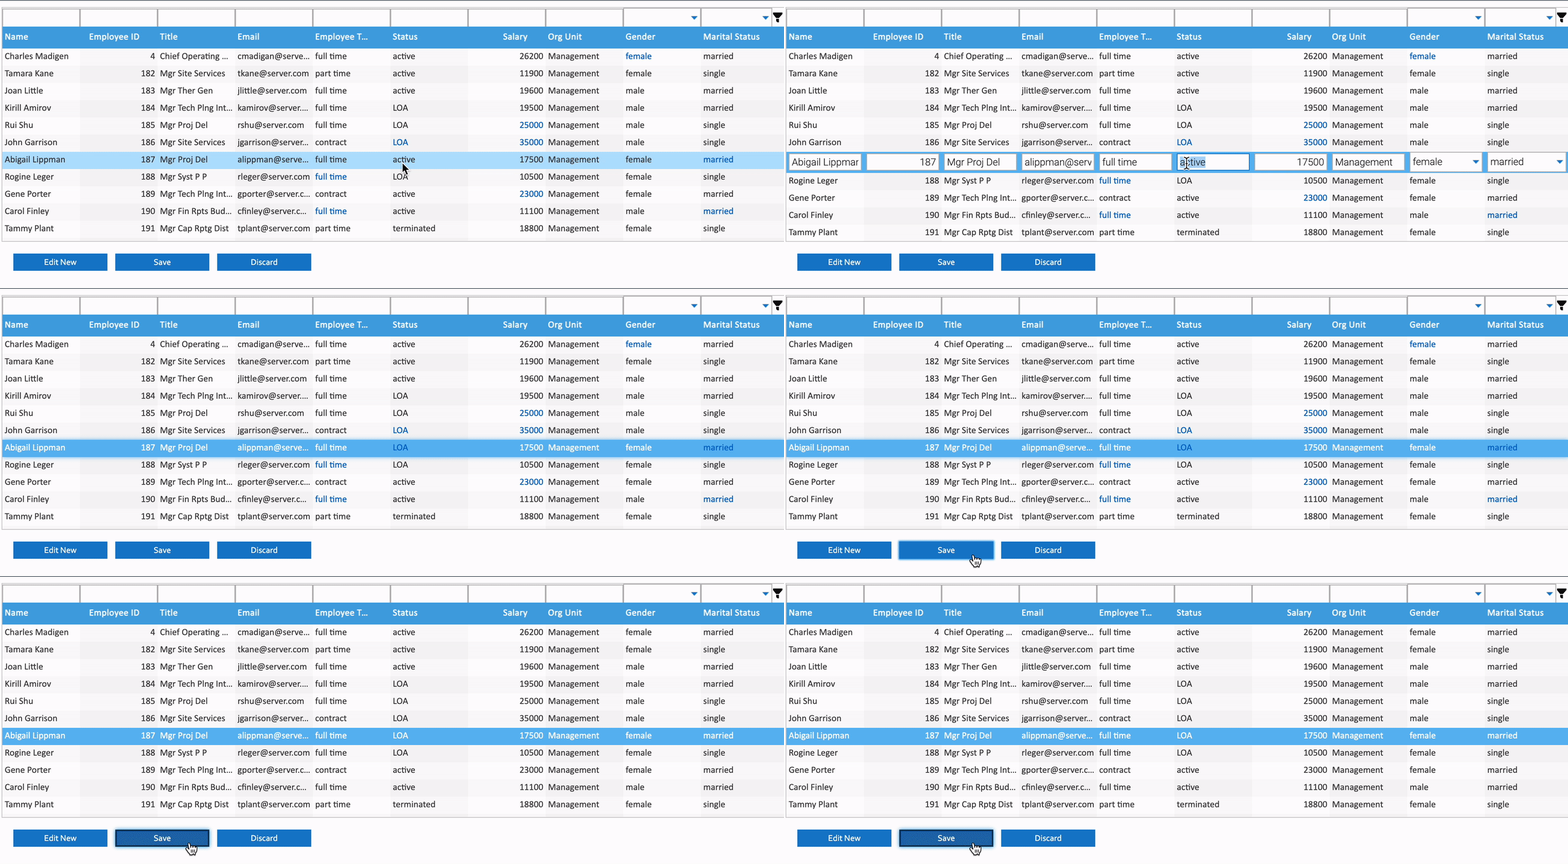
Using SmartClient’s robust React UI library, you can quickly jump into the editing state and update specific values in rows or cells within the grid. To enable editing, set canEdit: true on the ListGrid component. Then, set the edit action with an editEvent such as click or double-click. It can also be initiated by a startEditing() method. You can even move to a new editing line with a startEditingNew() call to add a new row to the grid.
Edits are saved automatically once you navigate outside the cell. But you can disable autosave by setting autoSaveEdits to false.
Beyond just editing the records, you can also validate the edited values against LGField.validators and DSField.validators.
Multi-record editing
You can further improve the grid features to enable multi-record editing in your React UI grid using SmartClient.
While the edits are saved automatically by default, you can also choose to batch and save up all the edits at once to the React UI grid. To do this, set autoSaveEdits: false on the ListGrid, then trigger the save action by making a call to saveEdits() or saveAllEdits(). SmartClient provides a separate pending style for the queued-up edits.
Once autoSaveEdits is disabled, SmartClient will queue up all the edits until you’re ready to save them. You can also discard unsaved edits with a call to discardAllEdits().
SmartClient makes all these quite easy – no need to start writing every React grid component or UI from scratch. Instead, developers can save countless amounts of time to focus on other productive tasks.
Read more: Multi-record editing in SmartClient
Saved Searches
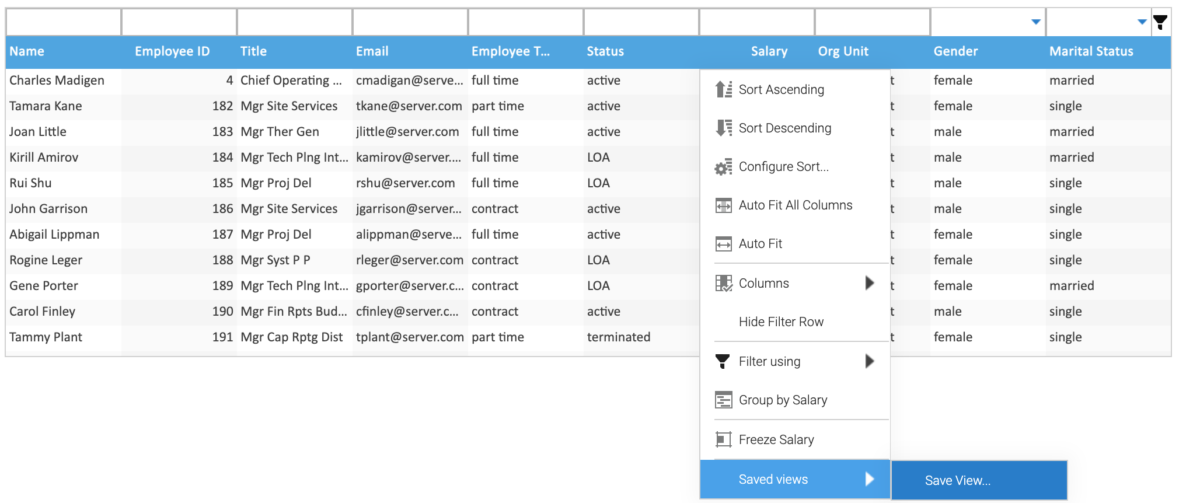
Before accessing the required records, you won’t need to click through two or more grid settings, including row searches, sort, and advanced criteria searches. You just need to right-click on the grid and navigate to the “saved-views” menu to add or select a saved search.
Read more: How to use Saved Search feature on grids in SmartClient
Dynamic value listing with SetFilterItem
Another powerful Excel-like feature in SmartClient is the SetFilterItem, which allows you to filter among all the values that are present for a given column in a grid.
To enable this feature, simply set filterEditorType: "SetFilterItem" on any field with repeating values in a ListGrid component. The SetFilterItem attribute does not require a predefined value map, and you can just filter dynamically based on the unique values in the dataset.
For example, with the feature enabled in the React UI grid, the attribute lets you filter the “Status” field based on the options in the dataset.
This is another way in which SmartClient’s React Grids give you all the power of Excel, without having to write any code!
It’s also extremely efficient: whenever it’s possible to do filtering in the browser (without contacting the server), the SetFilterItem does so automatically, so you get an instant response.
CubeGrid (Pivot Tables)
The CubeGrid, often compared to Pivot Tables in Excel, is a powerful feature in SmartClient. This feature offers advanced data analysis and visualization capabilities for React grids.
You can easily aggregate, summarize, and analyze complex datasets in an interactive and simple manner. In a React SmartClient application, the CubeGrid (or Pivot Grid) enables users to pivot data across multiple dimensions. You can dynamically drag and drop fields to rearrange data, drill down into details, and view summarized information based on their requirements.
This sort of flexibility is critical for data exploration and analyzing large datasets to make informed decisions.
To integrate a CubeGrid into a React application, you typically define the grid with its data source and specify the fields that can be used for pivoting. Here’s a basic example in the SmartClient showcase.
With SmartClient’s CubeGrid, React developers can work through large datasets using Excel-like data manipulation and insight generation functions.
Build React UI Grids in SmartClient
In the image above, we’ve added a SmartClient grid based to a React project, and it is visible once you’re signed in.
SmartClient’s incredible UI component suite provides Excel-like features for building dynamic and interactive grids in React. From CubeGrids akin to Excel’s pivot tables to inline and advanced filtering, multi-record editing, SmartClient makes it easy to build React grids.
SmartClient’s strength and comprehensive component suite further extends to Reify, a low-code platform built on top of it. Using Reify makes it possible to simply drag-and-drop SmartClient components to build sophisticated apps, with little or no coding at all. In fact, whatever app or screens built with Reify can be integrated into any IDE-based environment, including React – learn more here.
Start building React data grids with SmartClient in your React projects today.


