Coming Soon: SmartClient 11.1 | Smart GWT 6.1
It’s time to start talking about our next release, SmartClient 11.1 | Smart GWT 6.1. It is gonna be a good one!
Here are just a few of the features:
#1: Selenium: Easy way to check if images/icons load successfully
You can now use “/imageLoaded” as a manually added suffix for locators that target Img components or other components that show icons (Buttons, Labels, etc) as a means of testing whether the image has been successfully loaded by the browser. For example:
- //Button[ID=”cssButton”]/imageLoaded
- //ImgButton[ID=”imgButton”]/imageLoaded
- //Img[ID=”photo”]/imageLoaded
See our Using Selenium Guide for more info >
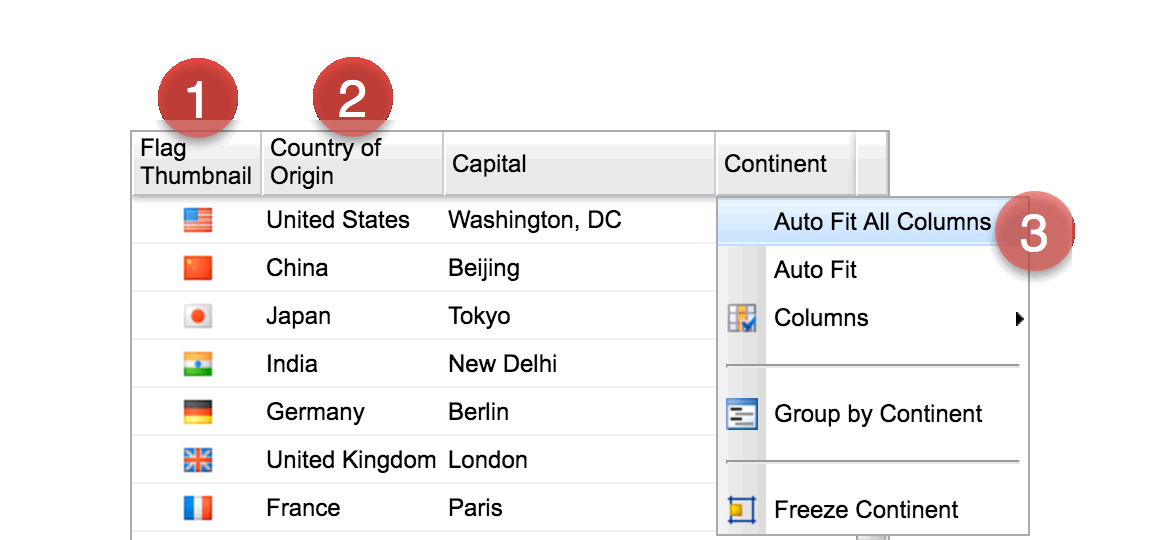
#2: grid support for auto-sizing to wrapped header titles
in 11.1 | 6.1, ListGrid fields can auto-fit to a multi-line title as well. See the example below.
- The first column auto-fits to its long title (“Flag Thumbnail”).
- The second column auto-fits to the data values, so there is extra space after the title.
- The user can also perform one time auto-fit of columns at runtime by double-clicking on any header or using the context-menu option.
#3 Histogram Chart
Histogram charts show a number of segments for each facet value on the x-axis, one for each legend facet value. However, unlike a column chart, in which each facet only has a length, in a histogram each segment has both a start (A – value property) and end value (B – defined via a metric).
You can see below that as the mouse moves across the various segments, the data values are shown in a hover, and that the segments can overlap each other. The stacking order can be changed through use of an additional metric.
APIs are also provided so that charts can set their data fill and line color. In the above chart, custom colors are applied via getDataColor(), using a map of the facetValueIds. Border color can also be applied using the new getDataLineColor() API.
Watch this space for more 11.1 | 6.1 features.
*** Remember: Upgrades to 11.1 | 6.1 are FREE to those who have already purchased 11.0 | 6.0. ***
For those not yet on 11.0 | 6.0, upgrade discounts are available and are based on the date of your last license purchase. View our License FAQs for more details. If you would like to upgrade, please contact us.
Thanks as always,
The Isomorphic Team!

