HTML5 Charts with mobile support
A new HTML5-based charting engine is now available as part of the Analytics module – download the Smart GWT or SmartClient Evaluation to try it out.
This charting engine is based on the Drawing module (which will also be available soon for direct use), which provides a cross-platform vector graphics engine that uses VML in IE6-8, and can use either SVG or <canvas> in other browsers. It works in mobile WebKit as well (iPhone, iPad, Android).
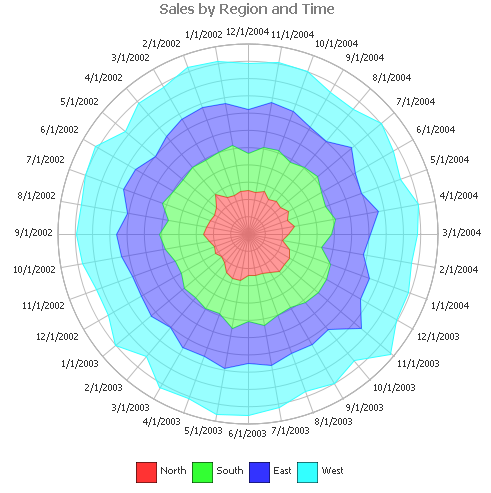
Here’s a sample Radar chart:
The new charting engine is delivered as a single component FacetChart which supports multiple different chart types. Like the CubeGrid component, a FacetChart actually understands the data model it’s displaying, and can provide different visualizations of it on the fly. In fact, there is a built-in context menu that allows end users to switch.
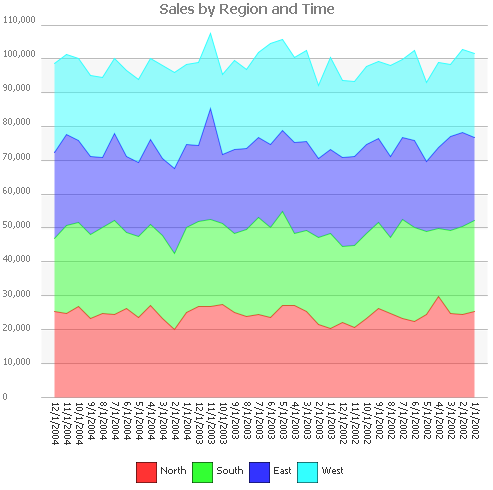
Picking ChartType -> Area leads to this:
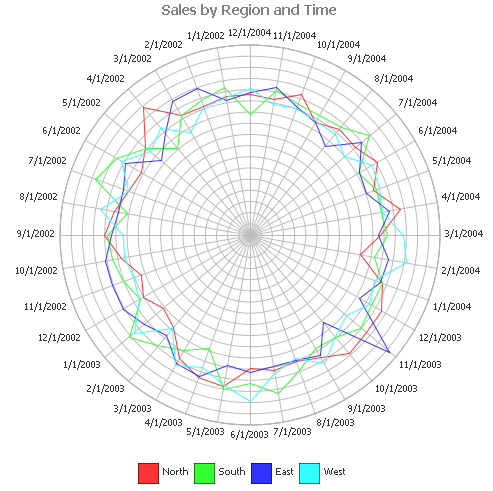
Picking Unstack would have led to this:
Finally, picking Swap Facets would have led to:
This last option is obviously a poor visualization of the dataset – which is exactly the point. If the user had started with this visualization, the context menu would have allowed them to navigate to any of the other visualizations shown above.
This is extremely key for dynamic, exploratory data analysis, a common use case among our customers. In several deployments, users can request a grid view of any dataset, customize it (show/hide/resize columns, set criteria), generate charts from the grid view, customize those as well, save all the settings and share it with other users. It’s essentially ad-hoc reporting in a browser.
SmartClient makes it simple to build such an interface, customized to the type of reporting your users need to do, without all the baggage of a general-purpose reporting engine. And because it’s based on SmartClient, adding entirely novel components is also simple (for example, molecular visualization).
But even if your application could not be called “exploratory data analysis”, why not let your users chart whatever they’d like to? SmartClient makes it trivial to generate a chart from any subset of the data shown in a ListGrid (ListGrid.chartData()), so, just add the feature to every grid via a context menu, and stop fielding enhancement requests for specific charts on specific screens.
Check out the online samples for Smart GWT and for SmartClient – note for the Advanced Cube samples, right click to chart the current cell by any two dimensions. Also check out a further sample of standalone FacetChart usage in Smart GWT, posted to the forums here.
Finally, download the Smart GWT 2.4 or SmartClient 8.0 Evaluation to try it out and get started building beautiful charts!


